

Conditional Formatting (CF)
Conditional Formatting (CF) allows users to color code data cells in the grid component to better separate values into tiers. Tiering of data visually helps users see outliers, trends, clusters and groupings of data within the result set of a given query.
Conditional Formatting also provides a mechanism to display certain values on the grid - like percentages or ranks.
Conditional Formatting of the cells is offered through two core mechanisms: client defined (using 11 methods) and "cube" defined (using MDX).
Cube Defined Conditional Formatting
MDX Settings on the Server
Cube designers are able to set colors for custom members and measures using the "fore_color" and "back_color" MDX properties on a given "create member" statement. These color settings can be written logically, to return different colors based on the value of the member. They are powerful to implement, since they can use logic and values in a cube that extend well beyond what the user can see in result set itself. In turn, Pyramid will reflect these colors in the grid.
For example, the following code creates a measure called margin. It then sets the background color to a numerical value (highlighted in green). In SSAS, the values are RGB integers that reflect the color spectrum.
CREATE MEMBER CURRENTCUBE.[Measures].[Margin]
AS [Measures].[Profit] / [Measures].[Sales],
FORMAT_STRING = "Percent",
BACK_COLOR = iif([Measures].currentmember> 0.06, 12057554,iif([Measures].currentmember<0.057, 12040191,8647420)),
NON_EMPTY_BEHAVIOR = { [Sales] },
VISIBLE = 1 ,
DISPLAY_FOLDER = 'Financials';
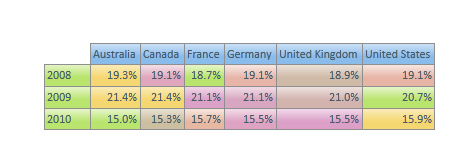
The resulting grid using a measure such as this would look similar to this:
MDX Settings on the Client
The same MDX definitions for foreground and background colors can be set when defining a custom member in Pyramid itself. They operate as per the server-defined MDX as described above, except they can be defined by end users in the custom member editor.
Client Side Conditional Formatting
Client Side CF is formatting determined on the client based on the results of the current query. Although they are arguably less powerful than cube-side CF (because they only operate on the query results), they are more accessible and configurable for most end users and do not require MDX scripting.
Client Side formatting comes in numerous variations and can be set for the grid as a whole via the Grid Ribbon or for specific columns and rows through the grid context menu.
Client Side Settings
The different variations in CF are driven by a combination of settings. Certain default settings can be selected by using the conditional formatting button in the grid ribbon or from the context menu. These defaults vary according to the type of CF used and the "zone" it is applied to. Users can customize these settings by use the "more format options" dialog found in the grid ribbon.
The various setting options are described below:
Zones (when applied form the grid ribbon)
- Grid - data points are evaluated across the entire range of data in the grid
-
Columns - data points are evaluated for the range of data WITHIN EACH COLUMN
- Rows- data points are evaluated for the range of data WITHIN EACH ROW
NOTE: when using the custom CF dialog for a given row or column, the "zone" options are replaced with edit mode options. Use the edit mode to decide how the CF logic should apply across the selected columns or rows.
See examples of CF zones here.
Dataset
- Lowest Level - the CF logic will apply across the selected zone but only at the lowest visible hierarchical level for each dimension used in the query.
- Flat - the CF logic will apply across all cells in the selected zone regardless of the hierarchical levels of the elements in each dimension
- Hierarchical - the CF logic will apply across all cells in the selected zone but will segment the calculations into separate cohorts that correspond to the hierarchies of each dimension
- Inner Hierarchy - the CF logic will apply across all cells in the selected zone but will segment the calculations into separate cohorts that correspond to the "inner" dimensions of the query only
See examples of CF datasets here.
Type
- Background - which apply a background color to the cell based on its relative value between the maximum, minimum and median points for the data set
- Foreground -
- Data Bars - which apply a mini bar to the cell based on the cells relative value to the maximum data point for the data set
- Icons - which apply an icon based on the cells range tertile position within the data set
- If icons are chosen, the user can also select which type of icon to use: lights, flags, signs and shapes.
- Values -
See examples of CF types here.
Algorithms
Depending on the type of CF chosen, there are various algorithms and options that can be set to customize the logic used to drive the formatting. These produce 11 methods for displaying data with conditional values.
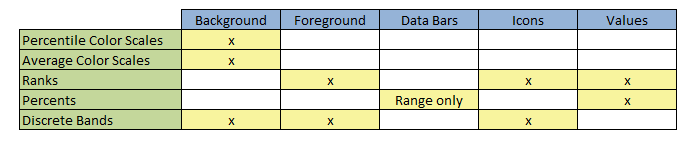
- Percentile Color Scales - produce a graduated color scale from minimum to midpoint(inflexion) to maximum
- The colors representing the 3 demarcation points can be set as well as the percentile position representing the inflexion point.
- By default the inflexion point is set to 50% or the median (50th percentile) of the selected zone. However, users can change the inflexion point.
- Average Color Scales - produce a graduated color scale from minimum to average to maximum
- The colors representing the 3 demarcation points can be set.
- Ranks - produce an ordered ranking of values into cohorts corresponding to the number of bands chosen
- Ranks can be driven by direct 'value' ranking or 'ordered' percentile ranks.
- Value ranking orders the values from high to low and then reflects the percentile their value fall into
- Percentile ranking orders the values from high to low and then reflects the percentile that their rank falls into
- For each type of rank method, users can decide how many "tiles" or bands to use for ranking the data: dual (2); tertile (3) or quartile (4)
- The colors for each tile/band selected can be set
- Ranks can be driven by direct 'value' ranking or 'ordered' percentile ranks.
- Percents - produce a measure of a cell's value in comparison to the total or a maximum
- Percents can be driven by 2 types of logic:
- Percent of Total (being a percentage of the total in the selected zone)
- Percent of Range (being a percentage of the absolute maximum value in the selected zone)
- User can select the color for the percents shown. Multiple color choices are provided when there are multiple cohorts
- Percents can be driven by 2 types of logic:
- Discrete Bands - produce discrete (specific) cohorts based on different logical calculations:
- Fixed Value banding is a 2, 3, or 4 value band framework with fixed ranges that are supplied by the end user to format the cells' values.
- Average banding is a 2 band framework designed to highlight all values below and above the average/mean
- Median banding is a 2 band framework designed to highlight all values below and above the median (50th percentile)
- Standard Deviation banding is a 2 band framework to highlight all values within and without the targeted standard deviation value from the mean.
- Percentile banding is a 2 band framework to highlight all values above and below the targeted percentile
See examples of CF algorithms here.
Home |
Table of Contents |
Index |
User Community
Pyramid Analytics © 2011-2022